You may have heard that A/B testing isn’t a viable approach for sites that don’t have enough traffic. Or that to reach statistical significance in a timely manner, you need to have thousands of visitors a day.
I’m here to tell you that those days of A/B testing FOMO for your low-traffic site are over! Having low traffic is no longer a barrier to optimize your site or learn about your users.
In this article, we discuss different tactics on how you can run A/B tests on your site and reach statistical significance without waiting for hundreds of days. We’ll also look at some alternative strategies that can help achieve the same thing as A/B testing: a better-optimized website.
Note: These tactics also apply to low-traffic pages. Maybe your site overall gets a ton of traffic, but there’s a specific page you’d like to optimize that doesn’t get nearly as much.
Tactics for Successful A/B Testing on Low-Traffic Sites
First, let’s define the term “low-traffic.” If your site or page has a few hundred visits a day or less, that would be considered “low-traffic.” Alright, now we can jump in.
Make Big Changes
The higher the MDE (Minimum Detectable Effect) of your proposed variation, the less time that will be needed to reach significance. The MDE, in simple terms, is how impactful you think the variation will be on the conversion rate.
Most A/B test duration calculators will include this field when deciding how long to run your test. See the screenshot below from VWO’s A/B Split & Multivariate Test Duration Calculator as an example.
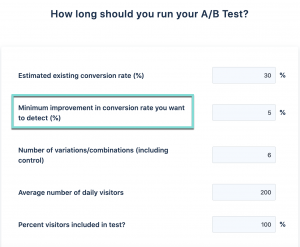
This metric is pretty much asking you, “How much difference do you anticipate the results to be for the variation compared to the original?” The more differences that exist in the variation versus the original, the higher this number should be.
This is one of the most common and impactful tactics for testing on low-traffic sites: creating a variation that is vastly different from the original. On high-traffic sites, you can test CTA button copy or small elements one at a time. With low-traffic sites, you don’t have that luxury.
You’ll want to make big changes to the page, or changes that you would anticipate to have a big difference in user behavior. Alternatively, you can make a bunch of small changes. The more design or copy changes you make to the page, the higher you can expect that MDE to be.
Jay Lee, Experimentation Program Strategist & Web Analytics Consultant at Microsoft, outlines some “big changes” you can apply to your experience:
“For low-traffic sites, it’s all about making larger changes that will allow you to observe a difference. For example – changing up pricing, offers, etc. Those make big differences.”
VWO explains how to determine what a “big change” looks like for your site:
“Understand their [your user’s] concerns. Know what primary factors they consider before taking an action on your site. For a funky clothing site which targets teenage and college students, pricing and free shipping can be very important. For a luxury-clothing brand that focuses on high-end celebrities, 1-day shipping guarantee or exclusive collection section on the site might be high-impact.”
Some examples of “big changes” include:
- Reformatting the layout of the page
- Changing up the pricing
- Changing the offer or the “value-add” of the page
- Using a completely different creative approach
Michael Wiegand, Director of Analytics at Portent, gives a great guideline for determining what a “big change” looks like:
“What I’d focus on would be things that capture the eye in the first split seconds a user sees the page: Headlines, Hero Images, CTA Buttons. If you can’t squint your eyes and notice the thing you’re testing, even with few variations, it probably isn’t going to be effective on a low-traffic site.”
Alternatively, if you aren’t sure what “big change” can take place, you can make a bulk amount of small changes. In this case, you can be more narrow in your optimization ideas. The only drawback here, as is the case with any A/B test where you make more than one change, is that you won’t know which change led to any performance difference.
You will always be balancing “optimizing” and “learning” when it comes to Conversion Rate Optimization. But there are other ways for low traffic sites to get more of those “learnings” without running an A/B test, which we outline later in the article under “Recommended Alternatives to A/B Testing.”
Use Fewer Variations
If you have a high-traffic website, we recommend always testing more than one variation against the original. Unfortunately, for low-traffic sites, we recommend the opposite.
It’s tempting to test all the different optimization ideas you have to solve a single problem. But with every variation you add to your test, the time to reach statistical significance also increases.
As we will touch on later, you can utilize usability testing to determine which variation to move forward with. While this might cost you some extra resources, it will save you much more time compared to running the test with all of the variations.
Test High-Funnel KPIs
These are also known as “micro conversions.”
One factor when plugging those metrics into A/B testing duration calculators is the existing conversion rate. The higher this conversion rate is, the less time you will need to reach significance.
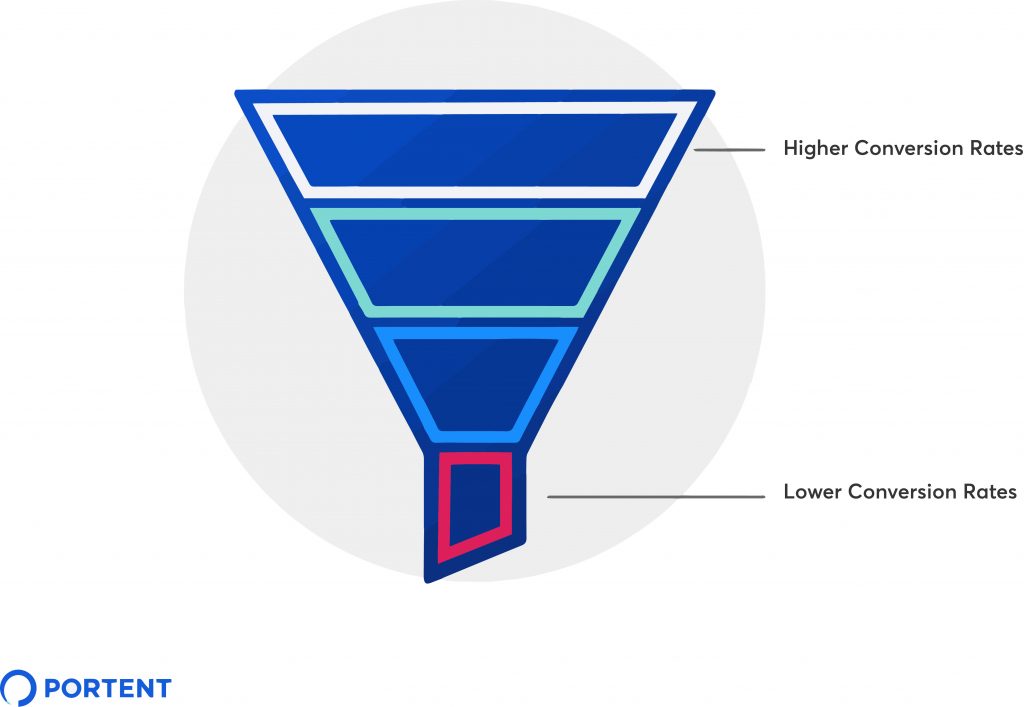
The lower in the funnel you go, the lower conversion rates get. Alternatively, as you go higher in the funnel, those conversion rates increase. Therefore, by running tests that are targeting higher-funnel KPIs, you will more likely be able to reach significance in a timely manner.
The best example here is for e-commerce. Beyond “add-to-cart” and “checkout complete” KPIs, look at the micro conversions that naturally come before that. This can include things like product searches, product detail page views, or other engagement metrics that happen well before an end purchase or conversion.
If you can determine the current conversion rates for these higher-funnel KPIs and their impact on the end conversion, you can still calculate the potential impact of your tests on the end conversion.
For example, if you know the conversion rate of users who view a product page and you also know the rate of people who view a product page then make a purchase, then you can directly anticipate the impact your test will have on the bottom line. In this case, the end conversion would be a secondary KPI you’ll want to measure.
Use Different Statistical Measurement Methods
Reaching statistical significance isn’t the only signal of your variation outperforming the original, especially when you are looking to reach that 99% mark.
When you don’t have the luxury of large sample sizes to get there, you will have to treat these methods more as “guidelines” than hard-to-follow rules.
For example, Optimizely gives you the option to lower the statistical significance level in which it would declare a winner. So if you wanted to reach about 70% or 80% significance, you would require a much smaller sample size versus going for 99%.
Bhavik Patel, Head of Conversion at Teletext Holidays and Founder of CRAP Talks, describes the type of approach you should take in regards to A/B testing on low-traffic sites:
“You’ve got to level the playing field by taking risks on tests which are bolder, loosen the reins on the statistical rigor of your analysis and not be afraid to cut your tests short (you need the traffic and don’t have time to “wait and see”).”
For the more statistically-savvy testers, you can use a completely different statistical measurement method when calculating significance for small sample sizes. There are arguments for different methods, but the ones we recommend are below (I’ve linked to calculators for each one for you):
Another tactic to get around statistical significance is to use confidence intervals to determine a winner.
Per Optimizely, a confidence interval (or “difference” interval) shows you the range of values that likely contains the actual (absolute) difference between the conversion rates that would show up if you were to implement that variation.
The article goes on to explain, “A useful and easy risk analysis that you can do with a difference interval is to report best case, worst case, and middle ground estimates of predicted lift by reading the upper endpoint, lower endpoint, and center of the difference interval, respectively.”
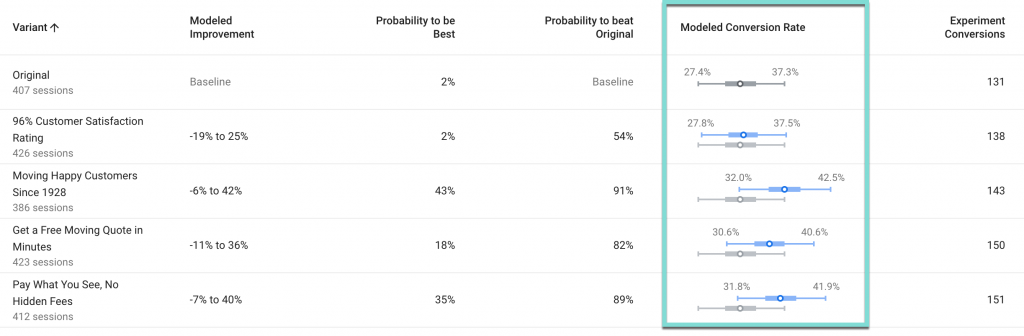
Below is a screenshot from Google Optimize of a test we ran for a client’s landing page headline. The highlighted region represents the confidence intervals. None of these tests have reached 99% significance, but you can see the range for the last three variations’ confidence interval is much higher than the original. Even though we didn’t reach significance, we could potentially call this test in favor of those variations based off of these confidence intervals.
Another way to get around waiting on statistical significance is to measure your test by sessions and not by users. The majority of the A/B testing calculators and tools out there (i.e., Optimizely and VWO) measure significance based on unique visitors. This means that the test treats each person as a participant in the sample group.
If you open this metric up to sessions, it will include instances where the same user visits the experiment two or more times. This strategy increases your sample size and reduces the time to reach statistical significance.
This approach is more appropriate for experiments that would only impact a user’s behavior within a single session versus their entire experience on the site. Therefore, some of those big changes we referred to before may not be applicable in this scenario.
Recommended Alternatives to A/B Testing
These recommendations can benefit all conversion rate optimizers out there, regardless of how much traffic comes to your site. They just happen to be great alternatives if you don’t have the traffic to test a specific optimization idea you have.
User Research
Moderated and unmoderated user tests are great ways to understand the “why” behind a person’s decision making. Have them navigate the experience you want to optimize and narrate their thoughts as they go through it. You only need five to eight participants to start to identify any patterns that would help improve on-site experience.
Design surveys are another beneficial approach to learning how you can improve your site’s experience. Simply present your page to a panel of users and ask them prodding questions such as, “What’s missing? What’s distracting? Is there anything we could add here that would help you make a decision?”
Design preference tests are similar to design surveys, except you are showing them multiple options and asking which one they prefer. This is where you can decide which variation to use if you are stuck on choosing from a group of them.
Some tools we use at Portent for user research include:
- Usertesting.com
- Zoom (for moderated user tests)
- UsabilityHub
- Optimal Workshop
User research has proven to be one of the most powerful tactics when coming up with ideas to optimize website experiences.
In 2019, Portent’s A/B tests that were aiming to solve a problem that was discovered through user research had a winning rate of 80.4%. For comparison, the average winning rate for all A/B tests was 60%. This highlights the idea that tests derived from user research projects have a higher chance of improving your experience, versus only using other methods in isolation, such as data or heuristic analyses.
Heuristic Analysis
A heuristic analysis is when someone reviews a page and makes recommendations on how to improve the experience through user experience (UX) and conversion rate optimization (CRO) principles or best practices.
But you don’t need to be an expert to do this.
Alex Abell, Conversion Optimization Expert and Founder of Lunchpool, provides two different approaches you can follow to perform your own heuristic evaluation:
“For low traffic websites, one of the most useful techniques I’ve found is to employ the use of heuristic analysis to make sweeping changes to the site. We call this a “radical redesign.” Two of the most popular heuristics to use are that of MarketingExperiments.com (C = 4M + 3V + 2(I – F) – 2A ) and WiderFunnel’s LIFT methodology. Although these formulas look complex, they are really just a mental shortcut that allows you to systematically look at your website through the eyes of your potential customer.”
In Summary
Having low traffic is no longer a barrier to optimize your site or learn about how your users engage with it. Some tactics for successful A/B testing on low-traffic sites include:
- Make big changes
- Use fewer variations
- Test high-funnel KPIs (micro-conversions)
- Use different statistical measurement methods
- Use statistical significance as a “guide”
- Use different measurement calculations
- Use confidence intervals
- Measure by sessions instead of users
There are also some great alternatives to A/B testing, which can benefit all conversion rate optimizers out there regardless of how much traffic you get to your site. You can try things such as:
- User Research
- User testing
- Design surveys
- Design preference tests
- Heuristic Analysis
- Follow UX and CRO principles
- MarketingExperiments formula
- WiderFunnel’s LIFT methodology
The two goals of A/B testing are to optimize your website’s performance and learn more about your users.
Referencing the tactics in this article will empower your (or your client’s) low-traffic site to achieve both of these goals. No more FOMO for low traffic sites. Get out there and start testing!